
empire spices and foods limited unlisted shares
Enquiry
About Empire Spices and Foods Limited Unlisted Shares
About the Company
(i) The Empire Spices and foods started its journey from a small shop in the holy city of Nashik in Maharashtra. The sheer quality and the taste of the exotic spice blends developed soon became a favorite with the masses and necessitated the formation of a dedicated manufacturing unit to fulfill market demand. Today, It became the stepping stone of the renowned brand of spices – “Rambandhu Masale”. Founded in 1994, Empire Spices & Foods Ltd manufactures spices. The Company offers basic spices, blend spices, specialty products, pickles, papads, asafoetida, and premium blend spices. Empire Spices & Foods offers services throughout India. Empire Spices & Foods exports its products.
(ii) The company operates from Nashik in Maharashtra.
(iii) The total paid-up capital is INR 4.84 cr. As per MCA, the last reported AGM (Annual General Meeting) of the company was held on 19 September 2019. (iv) All Products Are Manufactured & Marketed By - Empire Spices & Foods Ltd.
B) Products of the Company
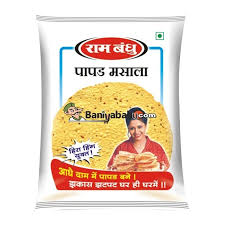
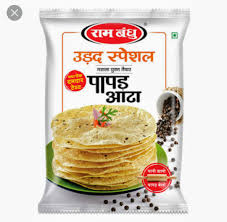
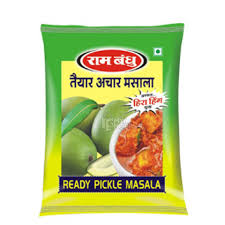
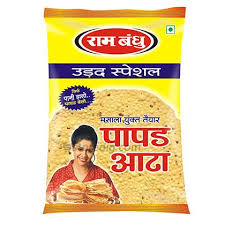
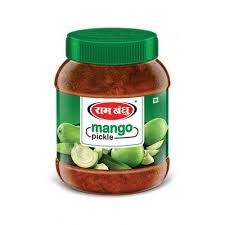
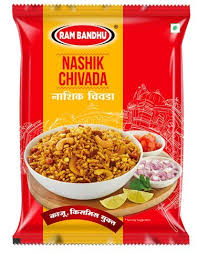
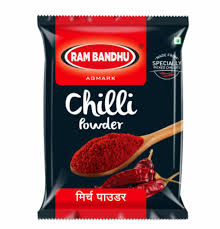
C) Below is the Corporate Video to understand more about the company.
Key Strengths of Empire Spices and Foods Limited Unlisted Share
1. The promoters' extensive experience: With more than 40 years of experience in the spice business, the promoters have been able to solidify the Rambandhu brand's recall value and create enduring bonds with clients and suppliers. Over the medium term, these elements ought to benefit the company.
2. Healthy financial risk profile: Despite debt-funded capital expenditure, the capital structure was comfortable as evidenced by a healthy gearing of 0.48 times and a moderate net worth of Rs 54.80 crore as of March 31, 2021. This capital structure is anticipated to stay comfortable over the medium term (capex). With interest coverage and net cash accrual to total debt ratios predicted to be 9.3 times and 0.63 times, respectively, in fiscal 2021, debt protection metrics were above average. The financial risk profile should stay stable going forward.
3. Moderately scaled operations: Revenue increased by over 10% annually over the last four fiscal years, reaching Rs 239.77 crore in fiscal 2021. Due to the vital nature of the products, like as spices, the topline increased by over 20% in fiscal 2021 despite the Covid-19 pandemic. Revenue growth was slowed in the Fy22, the moderate scale will be maintained.
Weekness of Empire Spices and Foods Limited Unlisted Share
1. Raw agricultural products like raw spices and mangoes are important raw materials. Susceptibility to fluctuations in raw material pricing. Given the competitive climate, any increase in input costs cannot be totally passed on to customers immediately, making the company vulnerable to any abrupt changes in raw material prices, which are influenced by government regulations, monsoon conditions, inflation, and other factors.
2. Additionally, the company competes in a competitive and fragmented sector; as a result, it is crucial to sustain sales growth and maintain stable operating profitability during business cycles.
| Price Per Equity Share | ₹ 585 |
| Lot Size | 100 Shares |
| 52 Week High | ₹ 585 |
| 52 Week Low | ₹ 550 |
| Depository | NSDL & CDSL |
| PAN Number | AAACE1056D |
| ISIN Number | INE041I01010 |
| CIN | U15100MH1994PLC080772 |
| RTA | Freedom Registry Limited |
| Market Cap (in cr.) | ₹ 280.8 |
| P/E Ratio | 20.53 |
| P/B Ratio | 3.04 |
| Debt to Equity | 0.55 |
| ROE (%) | 16.61 |
| Book Value | 192.4 |
| Face Value | 10 |
| Total Shares | 4800000 |
Financials
| P&L Statement | 2020 | 2021 | 2022 | 2023 |
|---|---|---|---|---|
| Revenue | 182 | 239 | 247 | 297 |
| Cost of Material Consumed | 108 | 135 | 140 | 187 |
| Gross Margins | 40.66 | 43.51 | 43.32 | 37.04 |
| Change in Inventory | -11 | 7 | 0 | -14 |
| Employee Benefit Expenses | 18 | 19 | 21 | 25 |
| Other Expenses | 49 | 51 | 65 | 73 |
| EBITDA | 18 | 27 | 21 | 26 |
| OPM | 9.89 | 11.3 | 8.5 | 8.75 |
| Other Income | 1 | 0 | 0 | 0.24 |
| Finance Cost | 4 | 3 | 2 | 3.15 |
| D&A | 3 | 4 | 4 | 4.64 |
| EBIT | 15 | 23 | 17 | 21.36 |
| EBIT Margins | 8.24 | 9.62 | 6.88 | 7.19 |
| PBT | 10 | 20 | 19 | 17.41 |
| PBT Margins | 5.49 | 8.37 | 7.69 | 5.86 |
| Tax | 2 | 7 | 5 | 3.73 |
| PAT | 8 | 13 | 14 | 13.68 |
| NPM | 4.4 | 5.44 | 5.67 | 4.61 |
| EPS | 16.53 | 26.86 | 29.17 | 28.5 |
| Financial Ratios | 2020 | 2021 | 2022 | 2023 |
|---|---|---|---|---|
| Operating Profit Margin | 9.89 | 11.3 | 8.5 | 8.75 |
| Net Profit Margin | 4.4 | 5.44 | 5.67 | 4.61 |
| Earning Per Share (Diluted) | 16.53 | 26.86 | 29.17 | 28.5 |
