Buy / Sell lotte india corporation limited unlisted shares
Current price: ₹570.00
About lotte india corporation limited unlisted shares
Company overview and key information
About Lotte India Corporation Limited Unlisted Shares
(i) Lotte India Corporation Limited came into existence post the takeover of Parrys Confectionery from Murugappa Group in 2004.
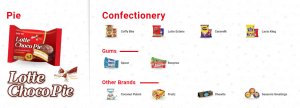
(ii) Lotte India Corporation Limited is engaged in the business of manufacturing and marketing of confectionery products. The parent company is Lotte Confectionery Company Limited, South Korea, which is one of the leading manufacturers of confectionery products. The Company has three manufacturing plants in India and manufactures/ distributes a wide range of confectionery products like Coffy Bite, Lacto King, Caramilk, Coconut Punch, and Chocopie.
(iii) Lotte India has been instrumental in creating ‘Pie’ category in India -Lotte Choco Pie enjoys near-monopoly status. The company has Coffy Bite & Lotte Chocopie as its most valued product.
(iv) Lotte Choco Pie [100% Vegetarian] enjoys great patronage with all consumer age groups offering a multi-textural eat experience. The company has earmarked huge plans for growing the pie category in India. With 26 CFAs and 4 regional offices, Lotte India’s products reach out to over a million retail outlets through 2000+ distributors spread across the country. Apart from the two state-of-the-art, fully automated Choco Pie facilities in Chennai and Rohtak, Lotte India has its own confectionery manufacturing unit in Nellikuppam (near Pondicherry). Additionally, the company outsources its confectionery manufacture to three other units spread across India.
Fundamentals
Key financial metrics for Lotte India Corporation Limited Unlisted Shares
Price Per Equity Share
₹ 575
Lot Size
50 Shares
52 Week High
₹ 575
52 Week Low
₹ 475
Depository
NSDL & CDSL
PAN Number
AAACP1916F
ISIN Number
INE185A01011
CIN
U15419TN1954PLC001987
RTA
Cameo Corporate Services
Market Cap (in cr.)
₹ 802
P/E Ratio
36.46
P/B Ratio
1.19
Debt to Equity
0.09
ROE (%)
3.32
Book Value
481.89
Face Value
10
Total Shares
13947035
Financials
P&L Statement
P&L Statement
2021
2022
2023
2024
Revenue
388
454
599
680
Cost of Material Consumed
179
249
363
366
Gross Margins
53.87
45.15
39.4
46.18
Change in Inventory
7
-10
-15
-2
Employee Benefit Expenses
41
42
47
54
Other Expenses
108
134
166
186
EBITDA
53
39
38
76
OPM
13.66
8.59
6.34
11.18
Other Income
9
4
11
11
Finance Cost
8
2
5
6
D&A
41
41
38
36
EBIT
12
-2
0
40
EBIT Margins
3.09
-0.44
0
5.88
PBT
12
1
7
45
PBT Margins
3.09
0.22
1.17
6.62
Tax
2
-10
8
23
PAT
10
11
-1
22
NPM
2.58
2.42
-0.17
3.24
EPS
9.26
10.13
-0.71
15.6
Financial Ratios
Financial Ratios
2021
2022
2023
2024
Operating Profit Margin
13.66
8.59
6.34
11.18
Net Profit Margin
2.58
2.42
-0.17
3.24
Earning Per Share (Diluted)
9.26
10.13
-0.71
15.6
P&L Statement
P&L Statement
2021
2022
2023
2024
Revenue
388
454
599
680
Cost of Material Consumed
179
249
363
366
Gross Margins
53.87
45.15
39.4
46.18
Change in Inventory
7
-10
-15
-2
Employee Benefit Expenses
41
42
47
54
Other Expenses
108
134
166
186
EBITDA
53
39
38
76
OPM
13.66
8.59
6.34
11.18
Other Income
9
4
11
11
Finance Cost
8
2
5
6
D&A
41
41
38
36
EBIT
12
-2
0
40
EBIT Margins
3.09
-0.44
0
5.88
PBT
12
1
7
45
PBT Margins
3.09
0.22
1.17
6.62
Tax
2
-10
8
23
PAT
10
11
-1
22
NPM
2.58
2.42
-0.17
3.24
EPS
9.26
10.13
-0.71
15.6
Financial Ratios
Financial Ratios
2021
2022
2023
2024
Operating Profit Margin
13.66
8.59
6.34
11.18
Net Profit Margin
2.58
2.42
-0.17
3.24
Earning Per Share (Diluted)
9.26
10.13
-0.71
15.6
Shareholding Patterns
Progress for 2021
Lotte Confectionery Company Limited, South Korea98.57%
Others1.43%
Progress for 2021
Lotte Confectionery Company Limited, South Korea98.57%