
merino industries limited unlisted shares
Enquiry
About Merino Industries Limited Unlisted Shares
(A) Background of the Company:
The Merino Group was commissioned in 1965 by the late Man Kumar Lohia and his brothers. The Group has since evolved into the largest manufacturer and exporter of laminates in India. The Company is presently managed by a team of multi-genre professionals. With more than half a decade of experience, the Company has established its respect and leadership in the country’s laminates segment. The Company is headquartered in Kolkata with manufacturing units in Hapur (Uttar Pradesh), Rohad (Haryana), Hosur (Tamil Nadu) and Dahej (Gujarat). The Company has a presence in almost all the States and markets its products in more than 60 countries. The Company’s network of more than 4000 dealers (doubled in the last five years) helps provide products across more than 2000 outlets.
(B) Business Segments:
(i) Interior Solutions: Merino is a versatile manufacturer and marketer of Interiors Solutions with a wide array of products for homes, offices, commercial and public areas. In Interior Solutions, plywood was their first product in 1974.

(ii) In the Agro Business:
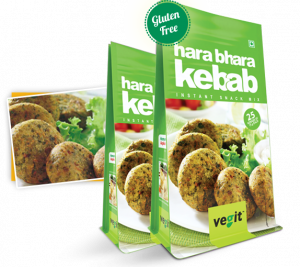
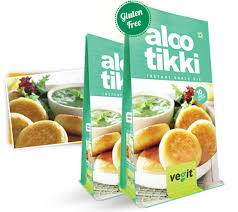
The Merino Group initially began in the cold storage business and subsequently diversified into farming, biotechnology, and food processing. The integration in both directions - forward and backward - has shaped the brand initiative in the FMCG market where we have launched potato flakes and ready to eat snack mixes under a very popular brand name 'Vegit'.

(iii) In Information Technology Services:
Merino Services Limited is a Business Consulting and IT Services organization providing value-added services as a Partner-in-Progress with the esteemed customers and business associates. They specialize in the design/implementation of various business solutions for our customers. Note: 90% of the business comes from Laminates and rest from others.
(c) Corporate Video to understand Merino Industries
| Price Per Equity Share | ₹ 3350 |
| Lot Size | 10 Shares |
| 52 Week High | ₹ 3450 |
| 52 Week Low | ₹ 3300 |
| Depository | NSDL & CDSL |
| PAN Number | AAACC9186C |
| ISIN Number | INE662B01017 |
| CIN | U51909WB1965PLC026556 |
| RTA | C B Management Services |
| Market Cap (in cr.) | ₹ 3745 |
| P/E Ratio | 30.69 |
| P/B Ratio | 2.73 |
| Debt to Equity | 0.53 |
| ROE (%) | 8.97 |
| Book Value | 1225.79 |
| Face Value | 10 |
| Total Shares | 11178679 |
Financials
| P&L Statement | 2021 | 2022 | 2023 | 2024 |
|---|---|---|---|---|
| Revenue | 1296.88 | 1747.89 | 2175 | 2252 |
| Cost of Material Consumed | 576.26 | 947.97 | 1200 | 1174 |
| Gross Margins | 55.57 | 45.76 | 44.83 | 47.87 |
| Change in Inventory | 9.04 | -36.8 | -52 | 44 |
| Employee Benefit Expenses | 163.45 | 207.97 | 247 | 290 |
| Other Expenses | 338.31 | 426.01 | 541 | 537 |
| EBITDA | 209.82 | 202.74 | 239 | 207 |
| OPM | 16.18 | 11.6 | 10.99 | 9.19 |
| Other Income | 41.97 | 48.34 | 30 | 57 |
| Finance Cost | 18.16 | 13.19 | 28 | 26 |
| D&A | 56.68 | 62.8 | 67 | 74 |
| EBIT | 153.14 | 139.94 | 172 | 133 |
| EBIT Margins | 11.81 | 8.01 | 7.91 | 5.91 |
| PBT | 176.92 | 175.07 | 174 | 164 |
| PBT Margins | 13.64 | 10.02 | 8 | 7.28 |
| Tax | 45.06 | 42.85 | 56 | 42 |
| PAT | 131.86 | 132.22 | 118 | 122 |
| NPM | 10.17 | 7.56 | 5.43 | 5.42 |
| EPS | 117 | 117.32 | 104.7 | 108.25 |
| Financial Ratios | 2021 | 2022 | 2023 | 2024 |
|---|---|---|---|---|
| Operating Profit Margin | 16.18 | 11.6 | 10.99 | 9.19 |
| Net Profit Margin | 10.17 | 7.56 | 5.43 | 5.42 |
| Earning Per Share (Diluted) | 117 | 117.32 | 104.7 | 108.25 |