

san engineering and locomotive company limited unlisted shares
Enquiry
About San Engineering and Locomotive Company Limited Unlisted Shares
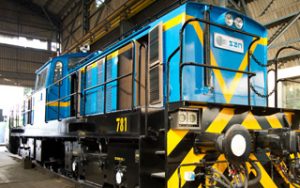
About Company : SAN was established in 1969 as a locomotive manufacturing company. Over the years, the company has grown its product portfolio and aligned its offering to changing market requirements. Today, SAN is a multi-product, multi-market enterprise that provides solutions in all segments of industries.
SAN is built on a strong foundation of innovation and technological excellence. Strategic partnerships to strengthen the in-house engineering capabilities and market reach, continuous focus on research and development, and a customer-centric approach have marked the company’s journey in the design and manufacture of locomotives, power packs, and gearboxes.
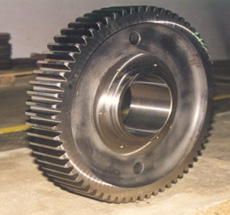
Manufacturing Facility: SAN is one of the few companies capable of designing, manufacturing transmissions, gearboxes, power packs, and locomotives. They manufacture turbo reversing transmissions, diesel-hydraulic locomotives, diesel-electric locomotives, power packs for a variety of applications, heavy duty cardan shafts and gearboxes for varied industries. Transmission and the drive elements are manufactured in-house using state-of-the-art machining centers and gear profile grinders. SAN manufacturing facilities are located in two plants and are equipped with advanced, high precision CNC horizontal and CNC vertical machining centers. The gear grinders are capable of manufacturing gears to very high standards. The manufacturing unit is supported by the R&D division that leads the SAN development program, a SOLID EDGE unit with advanced design capabilities, an integrated machine shop and a metrology laboratory.
The state-of-the-art manufacturing facilities are in two locations, Bangalore and Mysore.
Products
| Price Per Equity Share | ₹ 850 |
| Lot Size | 50 Shares |
| 52 Week High | ₹ 850 |
| 52 Week Low | ₹ 714 |
| Depository | NSDL & CDSL |
| PAN Number | AAECS5331H |
| ISIN Number | INE031H01012 |
| CIN | U74210KA1973PLC002424 |
| RTA | Canbank Computer Services |
| Market Cap (in cr.) | ₹ 378 |
| P/E Ratio | 13.51 |
| P/B Ratio | 1.47 |
| Debt to Equity | 0 |
| ROE (%) | 11.36 |
| Book Value | 576.29 |
| Face Value | 10 |
| Total Shares | 4450000 |
Financials
| P&L Statement | 2021 | 2022 | 2023 | 2024 |
|---|---|---|---|---|
| Revenue | 123 | 137 | 200 | 226 |
| Cost of Material Consumed | 62 | 73 | 102 | 114 |
| Gross Margins | 49.59 | 46.72 | 49 | 49.56 |
| Change in Inventory | 1 | -9 | 1 | -4 |
| Employee Benefit Expenses | 29 | 31 | 34 | 39 |
| Other Expenses | 20 | 25 | 33 | 37 |
| EBITDA | 11 | 17 | 30 | 40 |
| OPM | 8.94 | 12.41 | 15 | 17.7 |
| Other Income | 3 | 1.6 | 2.5 | 5 |
| Finance Cost | 1 | 1 | 1 | 1 |
| D&A | 6 | 6 | 6 | 6 |
| EBIT | 5 | 11 | 24 | 34 |
| EBIT Margins | 4.07 | 8.03 | 12 | 15.04 |
| PBT | 7 | 12 | 26 | 37 |
| PBT Margins | 5.69 | 8.76 | 13 | 16.37 |
| Tax | 2 | 4 | 7 | 9 |
| PAT | 5 | 8 | 19 | 28 |
| NPM | 4.07 | 5.84 | 9.5 | 12.39 |
| EPS | 11.24 | 17.98 | 42.7 | 62.92 |
| Financial Ratios | 2021 | 2022 | 2023 | 2024 |
|---|---|---|---|---|
| Operating Profit Margin | 8.94 | 12.41 | 15 | 17.7 |
| Net Profit Margin | 4.07 | 5.84 | 9.5 | 12.39 |
| Earning Per Share (Diluted) | 11.24 | 17.98 | 42.7 | 62.92 |