
schneider electric president systems unlisted shares
Enquiry
About Schneider Electric President Systems Unlisted Shares
History of Schneider Electric President Systems
Schneider Electric President Systems Limited was founded on October 22, 1984. It is a public limited company headquartered in Bangalore Rural, Karnataka. Schneider Electric President Systems Limited is a company that designs, manufactures, and sells standard and customized enclosure systems.
Timeline of Schneider Electric President Systems
1981 - Incorporated as APW President Systems Limited and started offering floor-standing aluminum or steel cabinets, accessories, card frames, and instrument cases, as well as accessory items.
1996 - A joint venture was formed with Vero Electronics of UK resulted in the formation of a company Vero President Systems Ltd. After two years APW (Applied Power Inc) led to change in the name from Vero President Systems ltd to APW President Systems Ltd.
2003 - Company received 'MAIT' award for excellence in Exports of IT related products. - In August 2003, the company announced plans to add 65,000 square feet of manufacturing space on an adjacent 2.8-acre plot in Attibele, Bangalore.
2004 -The first orders for CoolRack were given to APW President by ITC Ltd., Kolkata for 10 units for their data centre and ITC Bangalore for 8 units for their disaster recovery centre.
2005 - Listed on Bombay Stock Exchange
2006 - APW President received a trophy at a conference held in Bangkok for having the highest sales of any distributor in the APAC region for the year 2005. - Three new products for the networking market were introduced by the company in 2006: 4-Post Open Frame Rack, Ecosmart, and Tablerack. - APW President completed 25 years.
2007 -The manufacturing facility of APW President in Pune has increased its space from 23,500 square feet to 43,500 square feet. - In the SAIF Zone in Sharjah, United Arab Emirates, APW President founded APW Systems MEA (FZC) L.L.C. in June 2007. - With the installation of a Welding Robot the company introduced new ground for the enclosure industry.
2013 - Company has changed its name from APW President Systems Ltd to Schneider Electric President Systems Ltd.
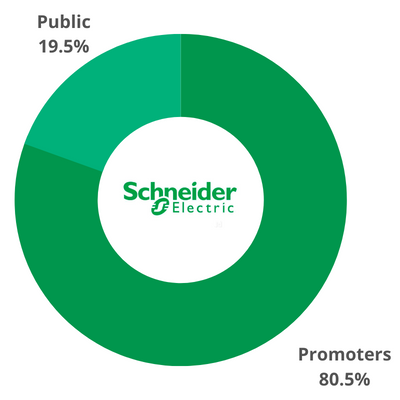
Shareholding Pattern of Schneider Electric President Systems
| Price Per Equity Share | ₹ 640 |
| Lot Size | ** Shares |
| 52 Week High | ₹ ** |
| 52 Week Low | ₹ ** |
| Depository | ** |
| PAN Number | AADCA1163G |
| ISIN Number | INE155D01018 |
| CIN | L32109KA1984PLC079103 |
| RTA | Link Intime |
| Market Cap (in cr.) | ₹ 387 |
| P/E Ratio | 12.9 |
| P/B Ratio | 2.39 |
| Debt to Equity | 0.09 |
| ROE (%) | 19.74 |
| Book Value | 267.86 |
| Face Value | 10 |
| Total Shares | 6048000 |
Financials
| P&L Statement | 2021 | 2022 | 2023 | 2024 |
|---|---|---|---|---|
| Revenue | 253 | 367 | 333 | 393 |
| Cost of Material Consumed | 174 | 265 | 226 | 261 |
| Gross Margins | 31.23 | 27.79 | 32.13 | 33.59 |
| Change in Inventory | -0.4 | -1.5 | 2 | -1 |
| Employee Benefit Expenses | 25 | 30 | 30 | 33 |
| Other Expenses | 31 | 44 | 47 | 53 |
| EBITDA | 23.4 | 29.5 | 28 | 47 |
| OPM | 9.25 | 8.04 | 8.41 | 11.96 |
| Other Income | 0 | 0.3 | 4 | 4 |
| Finance Cost | 0.5 | 2 | 1 | 1 |
| D&A | 5 | 6.6 | 7 | 9 |
| EBIT | 18.4 | 22.9 | 21 | 38 |
| EBIT Margins | 7.27 | 6.24 | 6.31 | 9.67 |
| PBT | 18 | 21 | 23 | 40 |
| PBT Margins | 7.11 | 5.72 | 6.91 | 10.18 |
| Tax | 4 | 5 | 6 | 10 |
| PAT | 14 | 16 | 17 | 30 |
| NPM | 5.53 | 4.36 | 5.11 | 7.63 |
| EPS | 23.33 | 26.67 | 28.33 | 50 |
| Financial Ratios | 2021 | 2022 | 2023 | 2024 |
|---|---|---|---|---|
| Operating Profit Margin | 9.25 | 8.04 | 8.41 | 11.96 |
| Net Profit Margin | 5.53 | 4.36 | 5.11 | 7.63 |
| Earning Per Share (Diluted) | 23.33 | 26.67 | 28.33 | 50 |