

shriram life insurance co. ltd unlisted shares
Enquiry
About Shriram Life Insurance Co. Ltd Unlisted Shares
Shriram Life Insurance is the Shriram Group company catering to the Life Insurance business of the Group. Let us first know briefly about the Shriram Group businesses and then we will move on to study Life Insurance Business.
Shriram Group
a) Shriram Group, established in 1974, is among the leading corporate houses in India and is a major player in the Indian financial services sector.
b) Shriram Group’s presence in financial services is diverse ranging from Commercial Vehicle Financing, Retail Financing, Enterprise Financing to small business, Housing Finance, Equipment Financing, Life Insurance, General Insurance, Retail Stock Broking, Distribution of Financial Products, and Wealth Advisory Services. Financial Services Companies in the Group manage assets of around INR 1,500.
Partnership with Sanlam to start Insurance Business
Sanlam, a leading financial services group and one of the largest insurers in South Africa has partnered with Shriram Group in both its Life and Non-Life Insurance ventures. The effective leveraging of the network and brand equity of Shriram Group and strategic guidance by the Sanlam Group has facilitated a steady growth of the insurance companies.
Shriram Life Insurance Business
Started in the year 2005, they offer different life insurance plans for their customers which include Individual Plans, Online Plans, and Group Plans. To know more about the plans you can visit. Shriram Life Insurance has a branch network of 588 branches and has an advisor force of 4455.
Financials Metrics
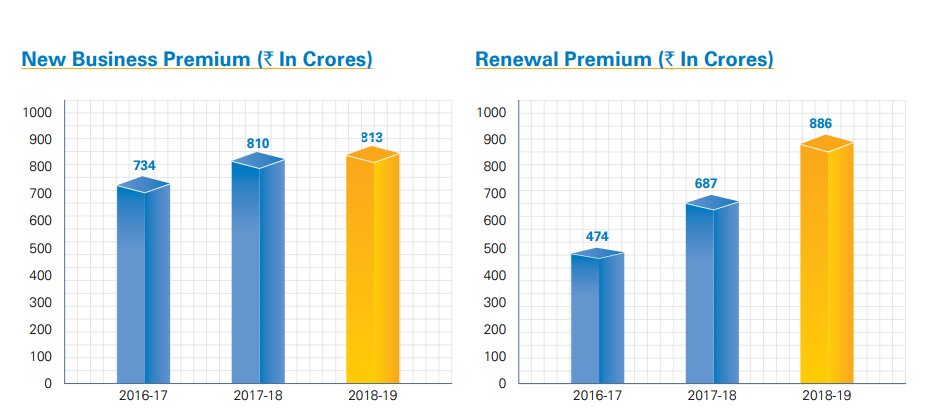
1. New Business Premium- We know when we purchase a policy we pay the premium. That premium when added together from all the users who have taken policy in a given year is known as New Business Premium.
2. Renewal Premium - This is the premium of all the policyholders who have taken insurance policy prior to the current year in which we are calculating the premium. This is an important factor because sometimes people take the policy and then say after 1Y, 2Y or any other year discontinue the premium.
3. Solvency ratio- It is similar to D/E in other businesses. The IRDAI requires life insurers to maintain a minimum Solvency Ratio of 150%. As compared to the minimum requirement of 150%, the Company’s Solvency Ratio, as of 31st March 2019, was 182%.
Market share of the Shriram Life Insurance business
a) As of 30.09.2020, there is a total of 24 Life Insurers in India.
b) The total premium as of 30.09.2020 stands at 1,24,727 Crores. This is the total premium collected in the first 6 months of FY20-21.
c) LIC has a total premium of 89980 Crores (72%). d) Private players have a total premium of 36709 Crores (28%).
Among Private Players, SBI Life (24%), HDFC Life(23%), ICICI Life (12%), Aditya Birla (6%) are the top players in terms of market share. e) For the first 6M FY20-21 Shriram Life Insurance has only 248 Crores of premiums. This translates into 0.067% market shares among private players.
Source: Link
Shriram Life Insurance FY20-21 Analysis:
(i) The domestic life insurance industry registered 7% growth for new business premium in financial year 2020-21, largely driven by growth in Individual & Group Single premium policy. While private insurers saw their growth at 16 %, Life Insurance Corporation of India (LIC) registered growth at 3 % in last financial year.
(ii) Shriram Life Insurance’s Individual New Business saw a growth of around 15% as compared to 14% growth for private industry and 10% growth for LIC.
(iii) In FY21, the total premium income of the company was Rs. 2019 Crores as compared to Rs. 1729 Crores in the previous year.
(iv) Shriram Life Insurance has the Solvency Ratio of 190%, against the requirement of 150%.
(v) This year Shriram Life Insurance has declared a dividend of Rs.1.67 per share. (vi) As on 31.03.2021, Shriram Life Insurance has a branch network of 455, and has active advisor force and POSPs of 3784 and 90 respectively.
| Price Per Equity Share | ₹ 400 |
| Lot Size | 50 Shares |
| 52 Week High | ₹ ** |
| 52 Week Low | ₹ ** |
| Depository | NSDL & CDSL |
| PAN Number | AAJCS1033P |
| ISIN Number | INE227H01016 |
| CIN | U66010TG2005PLC045616 |
| RTA | N/A |
| Market Cap (in cr.) | ₹ 7166.8 |
| P/E Ratio | 45.35 |
| P/B Ratio | 7.93 |
| Debt to Equity | N/A |
| ROE (%) | 17.47 |
| Book Value | 50.46 |
| Face Value | 0 |
| Total Shares | 179170000 |
Financials
| P&L Statement | 2021 | 2022 | 2023 | 2024 |
|---|---|---|---|---|
| GWP | 2018 | 2350 | 2546 | 3507 |
| NEP | 2013 | 2340 | 2539 | 3499 |
| Premium Earned | 2018 | 2350 | 2546 | 3507 |
| P&L on Sale of Investment | 68 | 93 | 33 | 107 |
| Interest, Dividend and Rent | 337 | 404 | 494 | 611 |
| Others Revenue | 116 | 100 | 21 | 123 |
| Total Revenue | 2539 | 2947 | 3094 | 4348 |
| Claims Incurred | 558 | 871 | 764 | 936 |
| Commission | 123 | 128 | 150 | 385 |
| Operating Expenses | 488 | 513 | 577 | 722 |
| Others Revenue Account | 1287 | 1424 | 1448 | 2092 |
| Operating Profit | 83 | 11 | 155 | 213 |
| Income from Investment | 37 | 75 | 50 | 58 |
| Other Income | 0 | 0 | 6 | 2 |
| Other Expenses | 6 | 84 | 4 | 3 |
| PBT (%) | 111 | 13 | 163 | 166 |
| Tax | 5 | 10 | 7 | 8 |
| PAT | 106 | 3 | 156 | 158 |
| EPS | 6.01 | 0.17 | 8.77 | 8.82 |
| Financial Ratios | 2021 | 2022 | 2023 | 2024 |
|---|---|---|---|---|
| Combined Ratio | 57.93 | 64.34 | 58.56 | 58.25 |
| Net-Loss Ratio | 0.28 | 0.37 | 0.3 | 0.27 |
| Mcap / GWP | 3.5 | 3.02 | 2.79 | 2.04 |